SQLTap - profiling and introspection for SQLAlchemy applications

Introduction
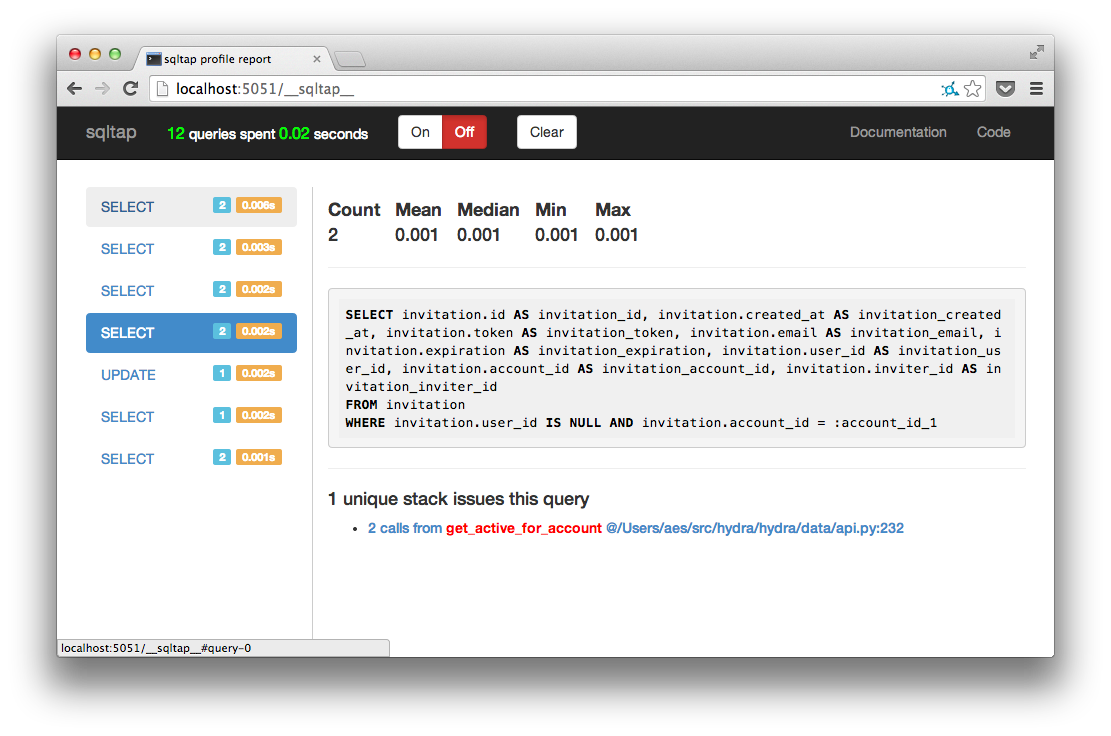
sqltap is a library that allows you to profile and introspect the queries that your application makes using SQLAlchemy.
- sqltap helps you understand:
- how many times a sql query is executed
- how much time your sql queries take
- where your application is issuing sql queries from
Motivation
When you work at a high level of abstraction, it’s more common for your code to be inefficient and cause performance problems. SQLAlchemy’s ORM is excellent and gives you the flexibility to fix these inefficiencies if you know where to look! sqltap is a library that hooks into SQLAlchemy to collect metrics on all queries you send to your databases. sqltap can help you find where in your application you are generating slow or redundant queries so that you can fix them with minimal effort.
Simple Example
This is the bare minimum you need to start profiling your application
profiler = sqltap.start()
session.query(Knights).filter_by(who_say = 'Ni').all()
statistics = profiler.collect()
sqltap.report(statistics, "report.html")
Advanced Features
sqltap provides the notion of a context function which lets you associate arbitrary data with each query as it is issued by sqlalchemy. For example, in a web framework, you may want to associate each query with the current request or page type so that you can easily aggregate statistics over those criteria later.
def context_fn(*args):
    """ Associate the request path, unique id with each query statistic """
    return (framework.current_request().path,
            framework.current_request().id)

# start the profiler immediately
profiler = sqltap.start(user_context_fn=context_fn)

def generate_reports():
    """ call this at any time to generate query reports reports """
    all_stats = []
    per_request_stats = collections.defaultdict(list)
    per_page_stats = collections.defaultdict(list)

    qstats = profiler.collect()
    for qs in qstats:
        all_stats.append(qs)

        page = qstats.user_context[0]
        per_page_stats[page].append(qs)

        request_id = qstats.user_context[1]
        per_request_stats[request_id].append(qs)

    # report with all queries
    sqltap.report(all_stats, "report_all.html")

    # a report per page
    for page, stats:
        sqltap.report(stats, "report_page_%s.html" % page)

    # a report per request
    for request_id, stats:
        sqltap.report(stats, "report_request_%s.html" % request_id)
Modules
sqltap
- sqltap.start(engine=<class 'sqlalchemy.engine.base.Engine'>, user_context_fn=None, collect_fn=None)
Create a new ProfilingSession and call start on it.
This is a convenience method. See ProfilingSession‘s constructor for documentation on the arguments.
Returns: A new ProfilingSession
- class sqltap.ProfilingSession(engine=<class 'sqlalchemy.engine.base.Engine'>, user_context_fn=None, collect_fn=None)
A ProfilingSession captures queries run on an Engine and metadata about them.
The profiling session hooks into SQLAlchmey and captures query text, timing information, and backtraces of where those queries came from.
You may have multiple profiling sessions active at the same time on the same or different Engines. If multiple profiling sessions are active on the same engine, queries on that engine will be collected by both sessions.
You may pass a context function to the session’s constructor which will be executed at each query invocation and its result stored with that query. This is useful for associating queries with specific requests in a web framework, or specific threads in a process.
By default, a session collects all of QueryStats objects in an internal queue whose contents you can retrieve by calling ProfilingSession.collect(). If you want to collect the query results continually, you may do so by passing your own collection function to the session’s constructor.
You may start, stop, and restart a profiling session as much as you like. Calling start on an already started session or stop on an already stopped session will raise an AssertionError.
You may use a profiling session object like a context manager. This has the effect of only profiling queries issued while executing within the context.
Example usage:
profiler = ProfilingSession()
with profiler:
    for number in Session.query(Numbers).filter(Numbers.value <= 3):
        print number
You may also use a profiling session object like a decorator. This has the effect of only profiling queries issued within the decorated function.
Example usage:
profiler = ProfilingSession()

@profiler
def holy_hand_grenade():
    for number in Session.query(Numbers).filter(Numbers.value <= 3):
        print number
- collect()
Return all queries collected by this profiling session so far. Throws an exception if you passed a collect_fn argument to the session’s constructor.
- start()
Start profiling
Raises AssertionError: If calling this function when the session is already started.
- stop()
Stop profiling
Raises AssertionError: If calling this function when the session is already stopped.
- sqltap.report(statistics, filename=None, template='html.mako', **kwargs)
Generate an HTML report of query statistics.
Parameters: - statistics – An iterable of QueryStats objects over which to prepare a report. This is typically a list returned by a call to collect().
- filename – If present, additionally write the report out to a file at the specified path.
- template – The name of the file in the sqltap/templates directory to render for the report. This is mostly intended for extensions to sqltap (like the wsgi extension). Not working when :param:`report_format` specified.
- report_format – (Optional) Choose the format for SQLTap report, candidates are [“html”, “wsgi”, “text”]
Returns: The generated SQLTap Report.
- class sqltap.QueryStats(text, stack, duration, user_context)
Statistics about a query
You should not create these objects, but your application will receive a list of them as the result of a call to ProfilingSession.collect() You may wish to to inspect of filter them before passing them into sqltap.report().
Attr text: The text of the query Attr stack: The stack trace when this query was issued. Formatted as returned by py:func:traceback.extract_stack Attr duration: Duration of the query in seconds. Attr user_context: The value returned by the user_context_fn set with sqltap.start().
sqltap.wsgi
- class sqltap.wsgi.SQLTapMiddleware(app, path='/__sqltap__')
SQLTap dashboard middleware for WSGI applications.
For example, if you are using Flask:
app.wsgi_app = SQLTapMiddleware(app.wsgi_app)
And then you can use SQLTap dashboard from /__sqltap__ page (this path prefix can be set by path parameter).
Parameters: - app – A WSGI application object to be wrap.
- path – A path prefix for access. Default is ‘/__sqltap__’